
procedure having been developed, it is presumed that the persistently observed effects, which though small are systematic, are due to a real ether-drift. The observed displacement of the interference fringes, for some unexplained reason, corresponds to only a fraction of the velocity of the earth in space. The theoretical solution of the problem of absolute motion which has been presented involves only the relative values of the magnitudes of the observed effect and does not require a knowledge of the cause of the reduction in the apparent velocity of the motion nor of the amount of this reduction. The validity of the solution is shown by using the newly found velocity and direction of the cosmic motion together with the known velocity and direction of the orbital motion of the earth for the calculation of the resultant effects for each of the four epochs.
The magnitude and direction of the resultant motion, as projected on the plane of the interferometer, are computed for intervals of two hours throughout the sidereal day for each epoch. The magnitudes multiplied by the reduction factor k are shown in Fig. 26 by the four smooth-line curves at the left. The azimuths of the calculated directions, as referred to the axes of the curves, are shown by the smooth line curves at the right. Superposed on these eight curves are the average curves of the actual observations, taken from Fig. 22.
The calculated curves fit the observations remarkably well, considering the nature of the experiment. Since the cosmical component of motion is relatively large, its effect predominates so that the phases of the curves remain nearly constant when charted on sidereal time; that is, the minima all occur at about 17 hours. It is the orbital component which causes the flattening of the curves for February and April and causes an accentuated minimum six months later. The effect of the orbital component causes the apparent leaning forward in the azimuth curves for August and September.
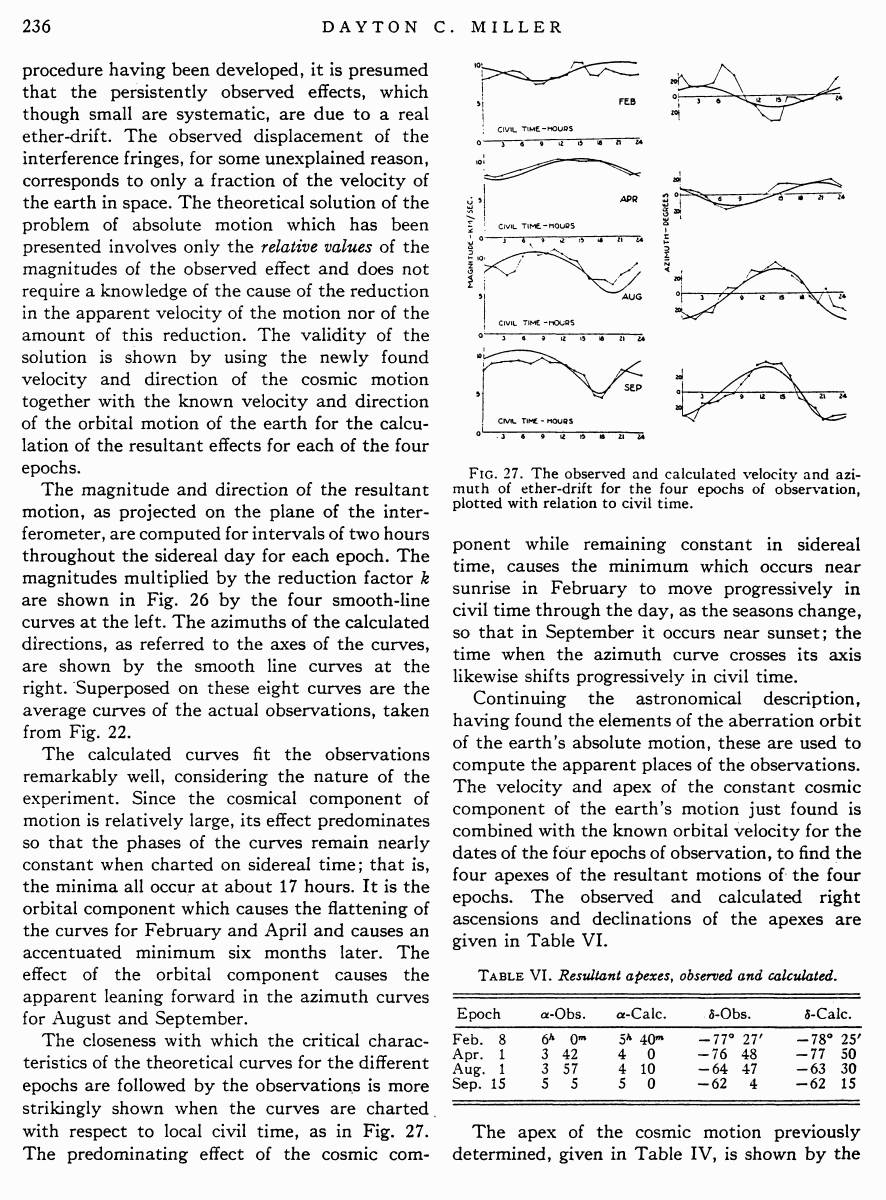
The closeness with which the critical characteristics of the theoretical curves for the different epochs are followed by the observations is more strikingly shown when the curves are charted. with respect to local civil time, as in Fig. 27. The predominating effect of the cosmic com-
Fig. 27. The observed and calculated velocity and azimuth of ether-drift for the four epochs of observation, plotted with relation to civil time.
ponent while remaining constant in sidereal time, causes the minimum which occurs near sunrise in February to move progressively in civil time through the day, as the seasons change, so that in September it occurs near sunset; the time when the azimuth curve crosses its axis likewise shifts progressively in civil time.
Continuing the astronomical description, having found the elements of the aberration orbit of the earth’s absolute motion, these are used to compute the apparent places of the observations. The velocity and apex of the constant cosmic component of the earth’s motion just found is combined with the known orbital velocity for the dates of the four epochs of observation, to find the four apexes of the resultant motions of the four epochs. The observed and calculated right ascensions and declinations of the apexes are given in Table VI.
Table VI. Resultant apexes, observed and calculated.
|
Epoch |
α–Obs. |
α–Calc. |
δ–Obs. |
δ–Calc. |
|
Feb. 8 |
6h 0m |
5h 40m |
–77° 27′ |
–78° 25' |
|
Apr. 1 |
3 42 |
4 0 |
–76 48 |
–77 50 |
|
Aug. 1 |
3 57 |
4 10 |
–64 47 |
–63 30 |
|
Sep. 15 |
5 5 |
5 0 |
–62 4 |
–62 15 |
The apex of the cosmic motion previously determined, given in Table IV, is shown by the
large star in Fig. 28 and the four calculated apexes for the resultant motions at the four epochs are shown by the small circles, which necessarily lie on the circle representing the calculated aberration orbit. The observed apexes for the four epochs are represented by the small stars. The location of the pole of the ecliptic is also shown. The close agreement between the calculated and observed apparent apexes would seem to be conclusive evidence of the validity of the solution of the ether-drift observations for the absolute motion of the earth and also for the effect of the orbital motion of the earth, which hitherto has not been demonstrated.
Fig. 28. Observed and calculated apexes of the absolute motion of the solar system.
It may seem surprising that such close agreement between observed and calculated places can be obtained from observations of such minute effects, and effects which are reputed to be of such difficulty and uncertainty. Perhaps an explanation is the fact that the star representing the final result for the February epoch is, in effect, the average of 8080 single determinations of its location; the star for the August epoch represents 7680 single determinations, that for September, 6640 and that for April, 3208 determinations.
Attention is called to the fact that the results here obtained are not opposed to the results originally announced by Michelson and Morley in 1887; in reality they are consistent with and confirm the earlier results. With additional
observations, the interpretation has been revised and extended.
The model, Fig. 29, represents, to scale, the conclusions of this study of the absolute motion of the earth. The earth is represented by the ball near the top of the model and the plane of the ecliptic is the horizontal plane through the center of the earth. The cosmic component of the earth's motion, which is the absolute motion of
Fig. 29. Model illustrating the components of ether-drift.
the solar system, is directed to the apex near the south pole of the ecliptic and is represented by the arrow near the top of the model and by the rod in its prolongation below the earth. The orbital motions for the four epochs of these observations are represented by the four arrows in the horizontal plane. The four resultant motions are shown by the diagonals of the four parallelograms corresponding to the several epochs. The resultant motion in the course of a year traces on the celestial sphere the aberration orbit of the earth represented by the circle near