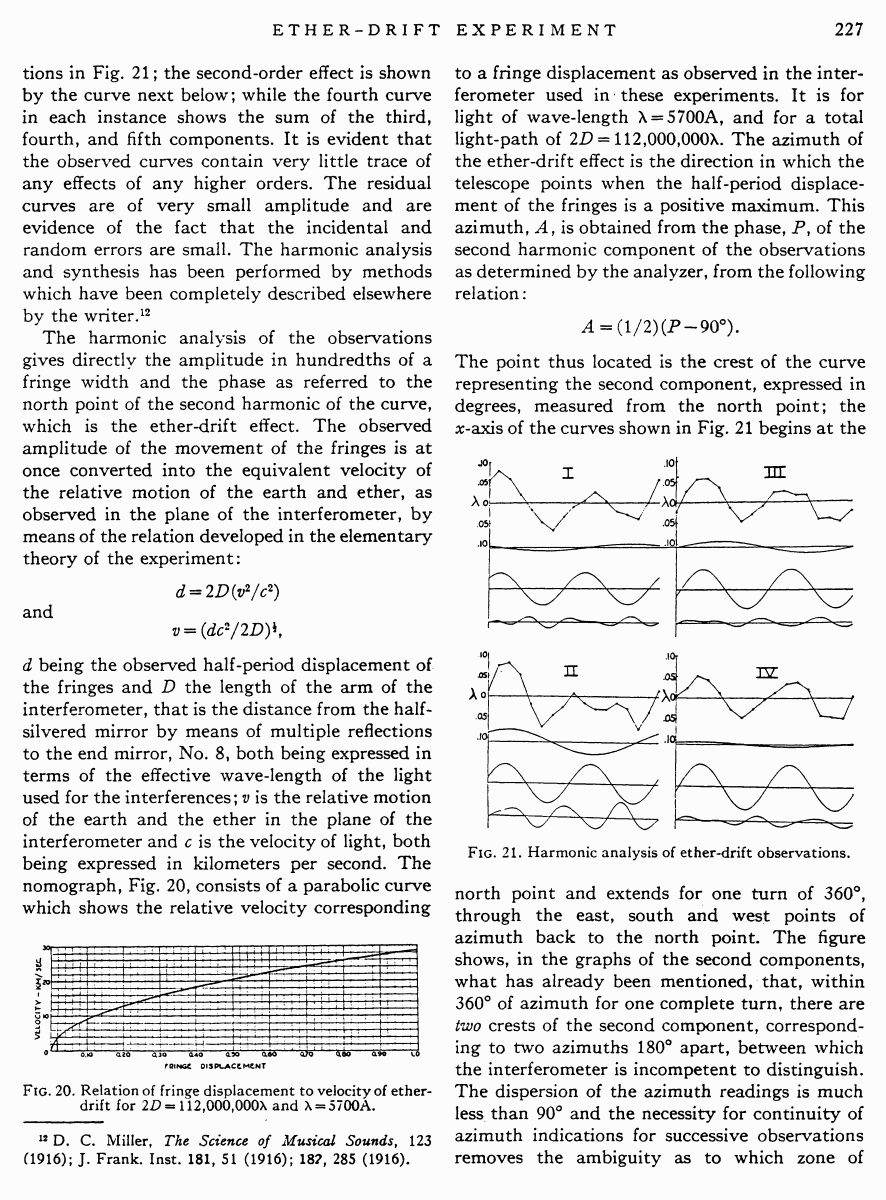
tions in Fig. 21; the second-order effect is shown by the curve next below; while the fourth curve in each instance shows the sum of the third, fourth, and fifth components. It is evident that the observed curves contain very little trace of any effects of any higher orders. The residual curves are of very small amplitude and are evidence of the fact that the incidental and random errors are small. The harmonic analysis and synthesis has been performed by methods which have been completely described elsewhere by the writer.12
The harmonic analysis of the observations gives directly the amplitude in hundredths of a fringe width and the phase as referred to the north point of the second harmonic of the curve, which is the ether-drift effect. The observed amplitude of the movement of the fringes is at once converted into the equivalent velocity of the relative motion of the earth and ether, as observed in the plane of the interferometer, by means of the relation developed in the elementary theory of the experiment:
d = 2D(v2/c2)
and
v = (dc2/2D)1/2,
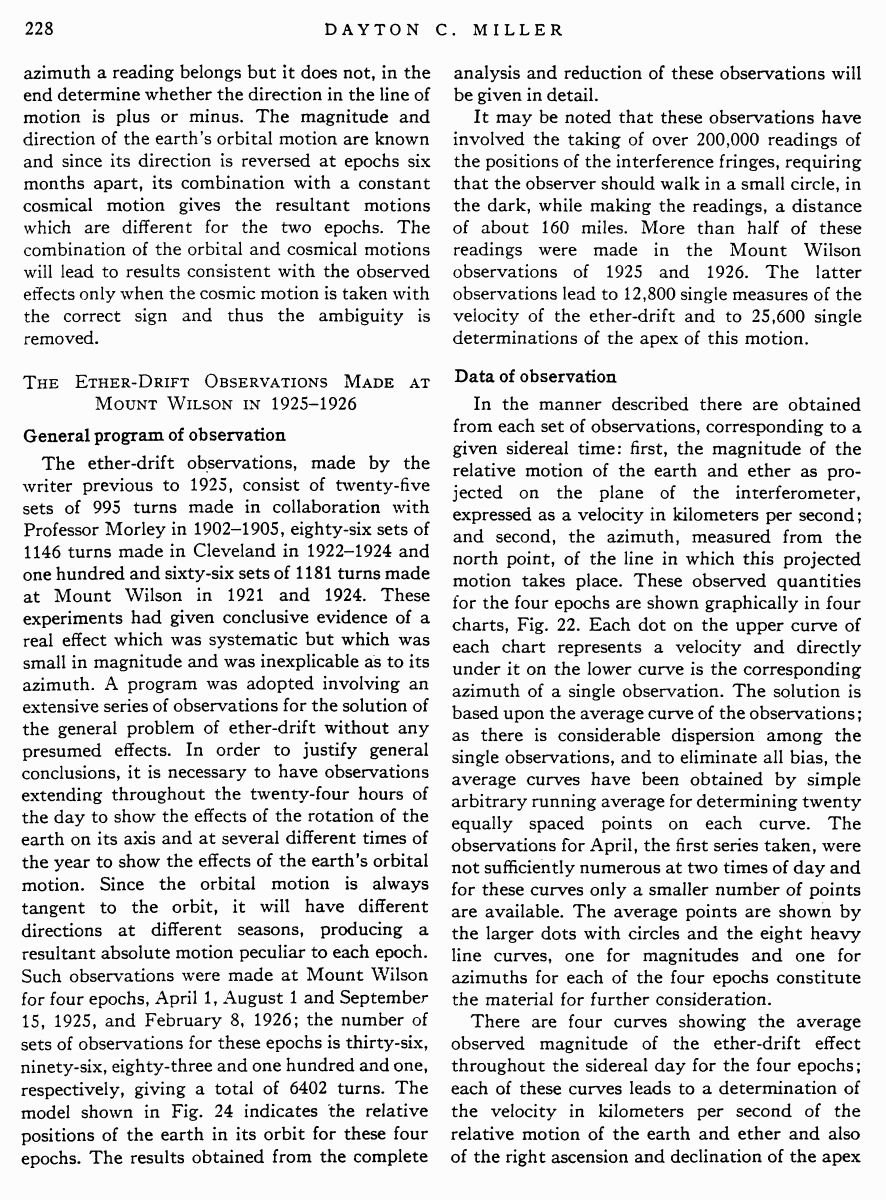
d being the observed half-period displacement of the fringes and D the length of the arm of the interferometer, that is the distance from the halfsilvered mirror by means of multiple reflections to the end mirror, No. 8, both being expressed in terms of the effective wave-length of the light used for the interferences; v is the relative motion of the earth and the ether in the plane of the interferometer and c is the velocity of light, both being expressed in kilometers per second. The nomograph, Fig. 20, consists of a parabolic curve which shows the relative velocity corresponding
Fig. 20. Relation of fringe displacement to velocity of ether-drift for 2D = 112,000,000λ and λ = 5700A.
12 D. C. Miller, The Science of Musical Sounds, 123 (1916); J. Frank. Inst. 181, 51 (1916); 182, 285 (1916).
to a fringe displacement as observed in the interferometer used in these experiments. It is for light of wave-length λ = 5700A, and for a total light-path of 2D = 112,000,000λ. The azimuth of the ether-drift effect is the direction in which the telescope points when the half-period displacement of the fringes is a positive maximum. This azimuth, A, is obtained from the phase, P, of the second harmonic component of the observations as determined by the analyzer, from the following relation:
A = (1/2) (P – 90°).
The point thus located is the crest of the curve representing the second component, expressed in degrees, measured from the north point; the x-axis of the curves shown in Fig. 21 begins at the
Fig. 21. Harmonic analysis of ether-drift observations.
north point and extends for one turn of 360°, through the east, south and west points of azimuth back to the north point. The figure shows, in the graphs of the second components, what has already been mentioned, that, within 360° of azimuth for one complete turn, there are two crests of the second component, corresponding to two azimuths 180° apart, between which the interferometer is incompetent to distinguish. The dispersion of the azimuth readings is much less than 90° and the necessity for continuity of azimuth indications for successive observations removes the ambiguity as to which zone of
azimuth a reading belongs but it does not, in the end determine whether the direction in the line of motion is plus or minus. The magnitude and direction of the earth’s orbital motion are known and since its direction is reversed at epochs six months apart, its combination with a constant cosmical motion gives the resultant motions which are different for the two epochs. The combination of the orbital and cosmical motions will lead to results consistent with the observed effects only when the cosmic motion is taken with the correct sign and thus the ambiguity is removed.
The Ether-Drift Observations Made at Mount Wilson in 1925-1926
General program of observation
The ether-drift observations, made by the writer previous to 1925, consist of twenty-five sets of 995 turns made in collaboration with Professor Morley in 1902-1905, eighty-six sets of 1146 turns made in Cleveland in 1922-1924 and one hundred and sixty-six sets of 1181 turns made at Mount Wilson in 1921 and 1924. These experiments had given conclusive evidence of a real effect which was systematic but which was small in magnitude and was inexplicable as to its azimuth. A program was adopted involving an extensive series of observations for the solution of the general problem of ether-drift without any presumed effects. In order to justify general conclusions, it is necessary to have observations extending throughout the twenty-four hours of the day to show the effects of the rotation of the earth on its axis and at several different times of the year to show the effects of the earth’s orbital motion. Since the orbital motion is always tangent to the orbit, it will have different directions at different seasons, producing a resultant absolute motion peculiar to each epoch. Such observations were made at Mount Wilson for four epochs, April 1, August 1 and September 15, 1925, and February 8, 1926; the number of sets of observations for these epochs is thirty-six, ninety-six, eighty-three and one hundred and one, respectively, giving a total of 6402 turns. The model shown in Fig. 24 indicates the relative positions of the earth in its orbit for these four epochs. The results obtained from the complete
analysis and reduction of these observations will be given in detail.
It may be noted that these observations have involved the taking of over 200,000 readings of the positions of the interference fringes, requiring that the observer should walk in a small circle, in the dark, while making the readings, a distance of about 160 miles. More than half of these readings were made in the Mount Wilson observations of 1925 and 1926. The latter observations lead to 12,800 single measures of the velocity of the ether-drift and to 25,600 single determinations of the apex of this motion.
Data of observation
In the manner described there are obtained from each set of observations, corresponding to a given sidereal time: first, the magnitude of the relative motion of the earth and ether as projected on the plane of the interferometer, expressed as a velocity in kilometers per second; and second, the azimuth, measured from the north point, of the line in which this projected motion takes place. These observed quantities for the four epochs are shown graphically in four charts, Fig. 22. Each dot on the upper curve of each chart represents a velocity and directly under it on the lower curve is the corresponding azimuth of a single observation. The solution is based upon the average curve of the observations; as there is considerable dispersion among the single observations, and to eliminate all bias, the average curves have been obtained by simple arbitrary running average for determining twenty equally spaced points on each curve. The observations for April, the first series taken, were not sufficiently numerous at two times of day and for these curves only a smaller number of points are available. The average points are shown by the larger dots with circles and the eight heavy line curves, one for magnitudes and one for azimuths for each of the four epochs constitute the material for further consideration.
There are four curves showing the average observed magnitude of the ether-drift effect throughout the sidereal day for the four epochs; each of these curves leads to a determination of the velocity in kilometers per second of the relative motion of the earth and ether and also of the right ascension and declination of the apex