of readings, distributed over the twenty-four hours of the day will, under favorable weather conditions, occupy a period of six or eight days. Such a series of observations is finally reduced to one group, corresponding to the mean date of the epoch; several series of this extent are represented in Fig. 22.
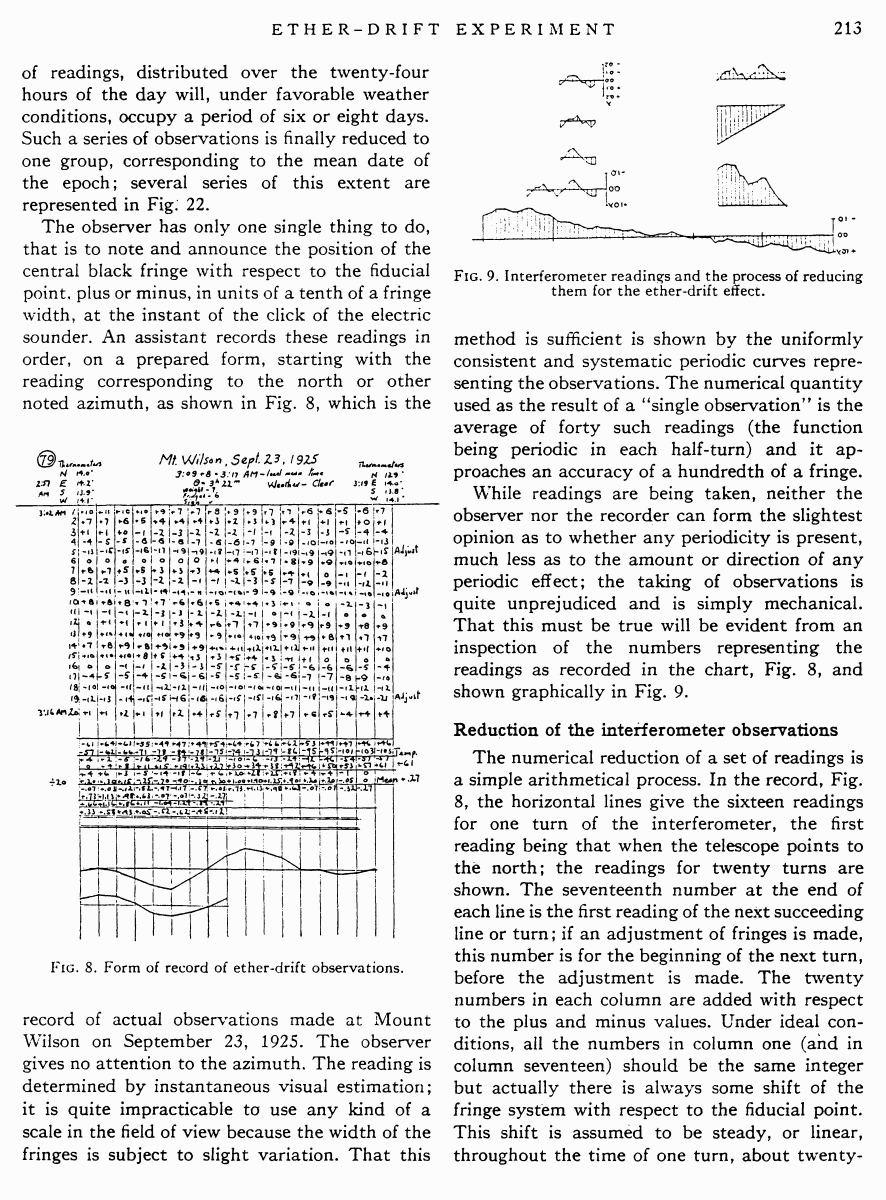
The observer has only one single thing to do, that is to note and announce the position of the central black fringe with respect to the fiducial point, plus or minus, in units of a tenth of a fringe width, at the instant of the click of the electric sounder. An assistant records these readings in order, on a prepared form, starting with the reading corresponding to the north or other noted azimuth, as shown in Fig. 8, which is the
Fig. 8. Form of record of ether-drift observations.
record of actual observations made at Mount Wilson on September 23, 1925. The observer gives no attention to the azimuth. The reading is determined by instantaneous visual estimation; it is quite impracticable to use any kind of a scale in the field of view because the width of the fringes is subject to slight variation. That this
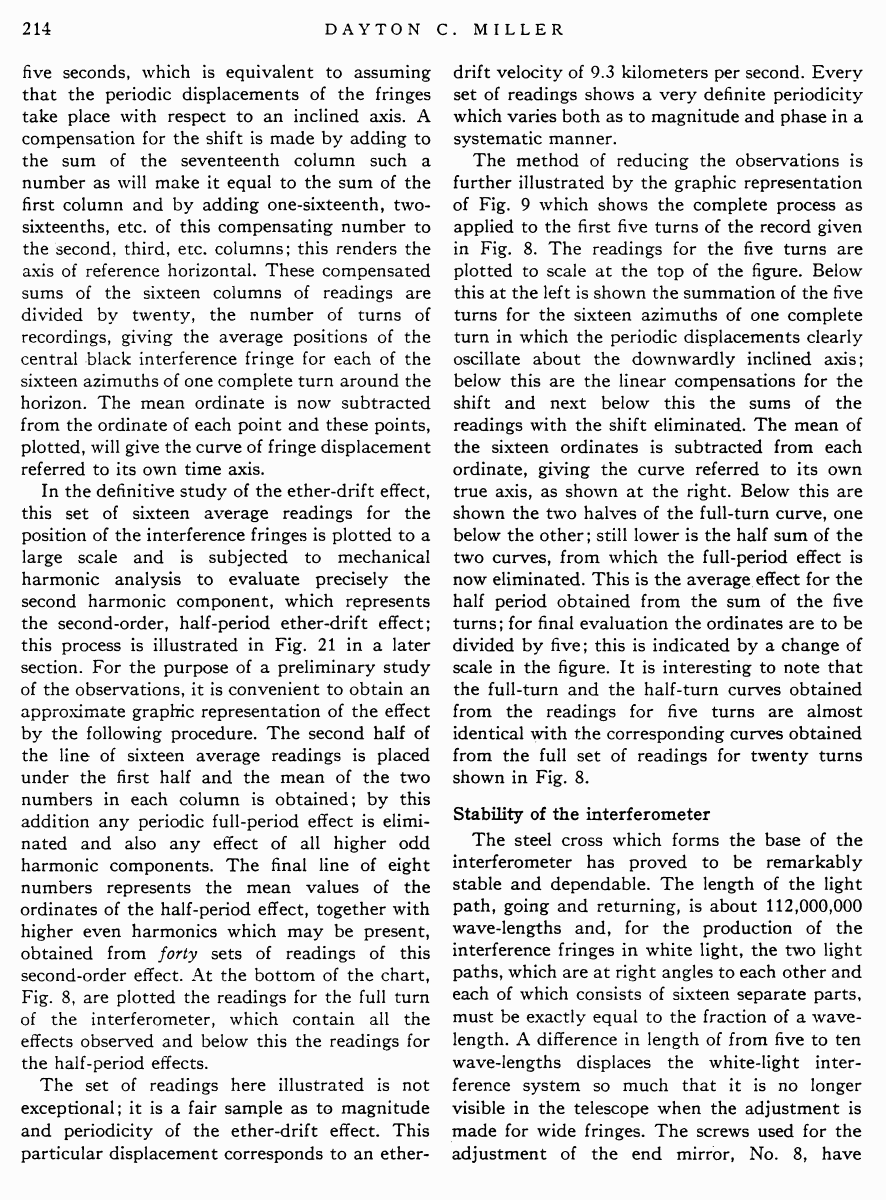
Fig. 9. Interferometer readings and the process of reducing them for the ether-drift effect.
method is sufficient is shown by the uniformly consistent and systematic periodic curves representing the observations. The numerical quantity used as the result of a “single observation” is the average of forty such readings (the function being periodic in each half-turn) and it approaches an accuracy of a hundredth of a fringe.
While readings are being taken, neither the observer nor the recorder can form the slightest opinion as to whether any periodicity is present, much less as to the amount or direction of any periodic effect; the taking of observations is quite unprejudiced and is simply mechanical. That this must be true will be evident from an inspection of the numbers representing the readings as recorded in the chart, Fig. 8, and shown graphically in Fig. 9.
Reduction of the interferometer observations
The numerical reduction of a set of readings is a simple arithmetical process. In the record, Fig. 8, the horizontal lines give the sixteen readings for one turn of the interferometer, the first reading being that when the telescope points to the north; the readings for twenty turns are shown. The seventeenth number at the end of each line is the first reading of the next succeeding line or turn; if an adjustment of fringes is made, this number is for the beginning of the next turn, before the adjustment is made. The twenty numbers in each column are added with respect to the plus and minus values. Under ideal conditions, all the numbers in column one (and in column seventeen) should be the same integer but actually there is always some shift of the fringe system with respect to the fiducial point. This shift is assumed to be steady, or linear, throughout the time of one turn, about twenty-
five seconds, which is equivalent to assuming that the periodic displacements of the fringes take place with respect to an inclined axis. A compensation for the shift is made by adding to the sum of the seventeenth column such a number as will make it equal to the sum of the first column and by adding one-sixteenth, two-sixteenths, etc. of this compensating number to the second, third, etc. columns; this renders the axis of reference horizontal. These compensated sums of the sixteen columns of readings are divided by twenty, the number of turns of recordings, giving the average positions of the central black interference fringe for each of the sixteen azimuths of one complete turn around the horizon. The mean ordinate is now subtracted from the ordinate of each point and these points, plotted, will give the curve of fringe displacement referred to its own time axis.
In the definitive study of the ether-drift effect, this set of sixteen average readings for the position of the interference fringes is plotted to a large scale and is subjected to mechanical harmonic analysis to evaluate precisely the second harmonic component, which represents the second-order, half-period ether-drift effect; this process is illustrated in Fig. 21 in a later section. For the purpose of a preliminary study of the observations, it is convenient to obtain an approximate graphic representation of the effect by the following procedure. The second half of the line of sixteen average readings is placed under the first half and the mean of the two numbers in each column is obtained; by this addition any periodic full-period effect is eliminated and also any effect of all higher odd harmonic components. The final line of eight numbers represents the mean values of the ordinates of the half-period effect, together with higher even harmonics which may be present, obtained from forty sets of readings of this second-order effect. At the bottom of the chart, Fig. 8, are plotted the readings for the full turn of the interferometer, which contain all the effects observed and below this the readings for the half-period effects.
The set of readings here illustrated is not exceptional; it is a fair sample as to magnitude and periodicity of the ether-drift effect. This particular displacement corresponds to an ether-
drift velocity of 9.3 kilometers per second. Every set of readings shows a very definite periodicity which varies both as to magnitude and phase in a systematic manner.
The method of reducing the observations is further illustrated by the graphic representation of Fig. 9 which shows the complete process as applied to the first five turns of the record given in Fig. 8. The readings for the five turns are plotted to scale at the top of the figure. Below this at the left is shown the summation of the five turns for the sixteen azimuths of one complete turn in which the periodic displacements clearly oscillate about the downwardly inclined axis; below this are the linear compensations for the shift and next below this the sums of the readings with the shift eliminated. The mean of the sixteen ordinates is subtracted from each ordinate, giving the curve referred to its own true axis, as shown at the right. Below this are shown the two halves of the full-turn curve, one below the other; still lower is the half sum of the two curves, from which the full-period effect is now eliminated. This is the average effect for the half period obtained from the sum of the five turns; for final evaluation the ordinates are to be divided by five; this is indicated by a change of scale in the figure. It is interesting to note that the full-turn and the half-turn curves obtained from the readings for five turns are almost identical with the corresponding curves obtained from the full set of readings for twenty turns shown in Fig. 8.
Stability of the interferometer
The steel cross which forms the base of the interferometer has proved to be remarkably stable and dependable. The length of the light path, going and returning, is about 112,000,000 wave-lengths and, for the production of the interference fringes in white light, the two light paths, which are at right angles to each other and each of which consists of sixteen separate parts, must be exactly equal to the fraction of a wavelength. A difference in length of from five to ten wave-lengths displaces the white-light interference system so much that it is no longer visible in the telescope when the adjustment is made for wide fringes. The screws used for the adjustment of the end mirror, No. 8, have